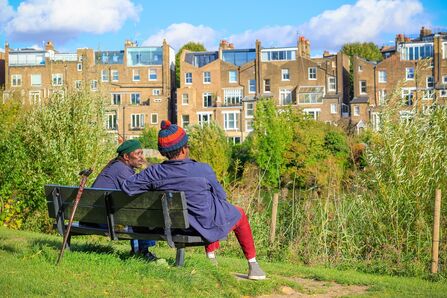
Too many people are stuck without access to nature

Too many people are stuck without access to nature

In a joint blog, Matt Browne of The Wildlife Trusts and Elliot Chapman-Jones of Liberal & Democrats for Nature & Climate publish new data analysis laying bare England’s lack of access to nature.

Time in nature is a proven health tonic; people who live close to accessible green and blue spaces live healthier, happier and longer lives. Successive Governments have committed to spread these health benefits across the country, through a promise to ensure that everyone has access to green or blue spaces within a 15-minute walk from home. 

New data analysis by The Wildlife Trusts and Liberals & Democrats for Nature & Climate shows there is still a long way to go to deliver on this promise. After assessing Defra data and applying it to Westminster boundaries, we can reveal that 238 parliamentary constituencies in England (44% of the total) still have low access to nature. We have defined low access to nature as 20% or more of properties in the constituency being more than 15 minutes’ walk away from accessible green or blue spaces.  

Such a proportion of places stuck without access to nature should be a major political concern. Sadly, it simply isn’t being treated as such. Over the past six months, despite 4 in 10 English MPs representing constituencies with low of levels of accessible nature, access to nature has been raised in Commons debates just three times. The Government had promised to bring forward an access to nature green paper, but there is no sign of its publication, or even of its active development within Defra. 
A closer dive into the numbers highlights why Defra should stop prevaricating, and act. Our data analysis shows a strong relationship between nature deprivation and economic deprivation. Seven of the ten most economically deprived constituencies in England feature on the low access to nature list, including:

  • Bradford West (3rd most economically deprived, 22nd most nature deprived)
  • Bradford East (4th most economically deprived, 20th most nature deprived)
  • Birmingham Perry Barr (5th most economically deprived, 24th most nature deprived). 

Communities that are persistently underserved by the economy are also being persistently locked out of the benefits nature provides. 

This summer of heatwaves should concentrate minds – those in the most under-served communities are being left without access to parks and rivers, and the cooling, health-protecting services they provide. Sitting in the shade of trees and dangling feet into flowing water should not be activities confined to wealthier postcodes.  

The numbers also show that low access to nature is a problem across English regions. Of the 238 low access to nature constituencies, the most are in London (50), followed by the South East (42) and the North West (28). 

Historical patterns of development are significant contributors to a lack of access to nature, the places that intensively urbanised in the 19th century in many cases still face Victorian levels of deprivation to nature, whether in the North or South. The problem also applies across different types of places. Whilst the three constituencies with the lowest access are unsurprisingly urban (Harrow West, Croydon West and Nottingham East), a fair chunk of low access to nature constituencies are in rural areas. 

In constituencies like South Norfolk and mid-Leicestershire, a lack of public parks in urban settlements and footpaths outside of them means that nature is inaccessible to some residents, despite living in the countryside.  

Access to nature is necessary for a healthy life, but for too many people nature remains too far away. What can be done? The solution starts with turning the Government’s well-meaning commitments into meaningful action. 


Ministers should swiftly introduce a legally binding target to ensure everyone can reach a green or blue space within a 15-minute walk of home. This would put its existing commitment into law and drive cross-government action to make access to nature a right enjoyed by every community. 

That target should be backed by a comprehensive Access to Nature Strategy, built from a widely consultative Green Paper, focused on tackling inequalities in access and removing the barriers that prevent people from enjoying green and blue spaces. As a priority, the Strategy should ensure new housing developments expand access to green space, not reduce it. Developers should be required to meet minimum Green Infrastructure Standards, including the 15-minute access target, while loopholes in Biodiversity Net Gain rules that weaken nature provision should be closed. 

The Strategy should also make it easier for communities to create new opportunities to enjoy nature. A national legal framework should make community campaigns for new recreational trails quicker and easier, while ensuring landowners are fairly compensated. This could unlock thousands of miles of disused railway lines as new walking, cycling and horse-riding routes, reconnecting communities with nature. 

Finally, an Access to Nature Strategy must recognise the importance of local authorities in achieving the 15-minute access target. The squeeze on public sector resources is disproportionately affecting parks and green spaces when compared to other service areas.  Local authorities should therefore be provided with the long-term funding they need to expand and better manage parks, alongside incentives to bring disused land into community use for new green spaces, allotments and walking, wheeling and cycling routes. 

We can’t wait for many more years for Defra to act to deliver these polices. This summer The Wildlife Trusts are asking people to share their experiences of nature, and how access to it has improved their lives. We will compile this evidence with our data analysis and send to Defra with clear recommendations for action. 

Add your voice
 

Andy Burnham has pledged that his Government will ‘help people to live well’. Helping more people to live well through closer, more accessible nature has been on Westminster’s to do list for too long. More nature, more health - now.  


Elliot Chapman-Jones is from Liberals and Democrats for Nature and Climate.

View the 238 English constituencies with the lowest access to nature


Constituency 

% of properties within 15 minutes of green or blue space  

1 

Harrow West 

28.77% 

2 

Croydon West 

29.34% 

3 

Nottingham East 

42.91% 

4 

Doncaster Central 

45.84% 

5 

Ruislip, Northwood and Pinner 

46.47% 

6 

Tynemouth 

47.77% 

7 

Lewisham West and East Dulwich 

48.40% 

8 

Harrow East 

48.45% 

9 

Sutton and Cheam 

50.02% 

10 

East Ham 

50.43% 

11 

Gedling 

51.23% 

12 

Portsmouth South 

51.54% 

13 

Wimbledon 

52.04% 

14 

Liverpool West Derby 

53.19% 

15 

Croydon South 

53.26% 

16 

Kingston upon Hull West and Haltemprice 

53.30% 

17 

Birmingham Erdington 

54.90% 

18 

Kingston and Surbiton 

54.99% 

19 

Liverpool Walton 

55.16% 

20 

Bradford East 

55.59% 

21 

Walthamstow 

55.74% 

22 

Bradford West 

55.81% 

23 

Blackpool North and Fleetwood 

56.38% 

24 

Birmingham Perry Barr 

57.25% 

25 

Brigg and Immingham 

57.30% 

26 

Islington North 

57.37% 

27 

Hartlepool 

57.62% 

28 

Kingston upon Hull North and Cottingham 

57.69% 

29 

Cramlington and Killingworth 

57.80% 

30 

Hampstead and Highgate 

58.00% 

31 

Torbay 

58.92% 

32 

Welwyn Hatfield 

59.14% 

33 

Bexleyheath and Crayford 

59.39% 

34 

Southampton Test 

59.61% 

35 

Lowestoft 

59.89% 

36 

Ealing Central and Acton 

59.91% 

37 

Newcastle upon Tyne North 

60.06% 

38 

Derby South 

60.34% 

39 

Finchley and Golders Green 

60.50% 

40 

Kettering 

60.71% 

41 

Worthing West 

60.77% 

42 

Knowsley 

60.87% 

43 

Coventry North West 

60.99% 

44 

Portsmouth North 

61.16% 

45 

Coventry South 

61.43% 

46 

Cheltenham 

62.02% 

47 

Northampton North 

62.34% 

48 

Luton North 

62.39% 

49 

Wythenshawe and Sale East 

62.95% 

50 

Leyton and Wanstead 

62.98% 

51 

Exmouth and Exeter East 

63.03% 

52 

Clapham and Brixton Hill 

63.23% 

53 

Bromley and Biggin Hill 

63.78% 

54 

Great Grimsby and Cleethorpes 

63.81% 

55 

Derby North 

63.82% 

56 

Hendon 

63.82% 

57 

Birmingham Northfield 

63.94% 

58 

Northampton South 

64.31% 

59 

Uxbridge and South Ruislip 

64.45% 

60 

Sutton Coldfield 

64.47% 

61 

Stretford and Urmston 

64.57% 

62 

Oldham West, Chadderton and Royton 

64.63% 

63 

Exeter 

64.94% 

64 

Broadland and Fakenham 

65.12% 

65 

Peterborough 

65.28% 

66 

Spelthorne 

65.31% 

67 

Beckenham and Penge 

65.48% 

68 

Luton South and South Bedfordshire 

65.51% 

69 

Bethnal Green and Stepney 

65.51% 

70 

Pontefract, Castleford and Knottingley 

65.69% 

71 

Bristol North East 

65.80% 

72 

Liverpool Garston 

65.94% 

73 

Filton and Bradley Stoke 

65.97% 

74 

South West Devon 

66.17% 

75 

Mid Norfolk 

66.28% 

76 

Gravesham 

66.43% 

77 

Norwich North 

66.45% 

78 

Chelsea and Fulham 

66.82% 

79 

East Worthing and Shoreham 

67.17% 

80 

Southport 

67.24% 

81 

Brent West 

67.31% 

82 

Bournemouth East 

67.38% 

83 

Bridlington and The Wolds 

67.63% 

84 

Hornchurch and Upminster 

67.65% 

85 

Kingston upon Hull East 

67.67% 

86 

Norwich South 

67.81% 

87 

Brighton Pavilion 

67.85% 

88 

Gorton and Denton 

67.87% 

89 

Croydon East 

67.91% 

90 

Thurrock 

68.14% 

91 

Eltham and Chislehurst 

68.22% 

92 

Blackpool South 

68.37% 

93 

Smethwick 

68.41% 

94 

Peckham 

68.65% 

95 

Windsor 

68.67% 

96 

Birmingham Hall Green and Moseley 

68.67% 

97 

Washington and Gateshead South 

68.79% 

98 

Sheffield Central 

68.82% 

99 

Romford 

68.92% 

100 

Harborough, Oadby and Wigston 

69.05% 

101 

South Norfolk 

69.20% 

102 

Liverpool Wavertree 

69.30% 

103 

Mid Leicestershire 

69.31% 

104 

Holborn and St Pancras 

69.71% 

105 

Birmingham Edgbaston 

69.92% 

106 

Bognor Regis and Littlehampton 

70.06% 

107 

Nottingham South 

70.21% 

108 

Bristol Central 

70.26% 

109 

South Devon 

70.26% 

110 

South East Cornwall 

70.32% 

111 

Scunthorpe 

70.34% 

112 

Newcastle upon Tyne Central and West 

70.52% 

113 

Brent East 

70.80% 

114 

Houghton and Sunderland South 

70.84% 

115 

Southend East and Rochford 

70.84% 

116 

Wolverhampton South East 

70.90% 

117 

Chipping Barnet 

70.97% 

118 

Gillingham and Rainham 

71.13% 

119 

Esher and Walton 

71.17% 

120 

Goole and Pocklington 

71.26% 

121 

Lewisham North 

71.42% 

122 

Hammersmith and Chiswick 

71.44% 

123 

Leeds East 

71.53% 

124 

Old Bexley and Sidcup 

71.54% 

125 

Great Yarmouth 

71.85% 

126 

Reading Central 

71.86% 

127 

Stockton North 

72.00% 

128 

Watford 

72.16% 

129 

Earley and Woodley 

72.17% 

130 

Stockport 

72.21% 

131 

Surrey Heath 

72.23% 

132 

Liverpool Riverside 

72.25% 

133 

Aldershot 

72.41% 

134 

Wirral West 

72.51% 

135 

Halesowen 

72.68% 

136 

Clacton 

72.73% 

137 

Lewisham East 

72.76% 

138 

Wellingborough and Rushden 

72.86% 

139 

Leeds West and Pudsey 

72.91% 

140 

Manchester Withington 

73.01% 

141 

Fylde 

73.14% 

142 

Poole 

73.22% 

143 

Basingstoke 

73.35% 

144 

Leicester South 

73.56% 

145 

Solihull West and Shirley 

73.84% 

146 

Ellesmere Port and Bromborough 

73.86% 

147 

Chingford and Woodford Green 

73.88% 

148 

Brentford and Isleworth 

73.96% 

149 

New Forest West 

74.07% 

150 

South Cambridgeshire 

74.10% 

151 

Wolverhampton North East 

74.11% 

152 

Bassetlaw 

74.24% 

153 

Carshalton and Wallington 

74.24% 

154 

Cheadle 

74.39% 

155 

Plymouth Sutton and Devonport 

74.48% 

156 

Bradford South 

74.54% 

157 

Ipswich 

74.56% 

158 

Gosport 

74.60% 

159 

Manchester Rusholme 

74.61% 

160 

Mansfield 

74.68% 

161 

South West Norfolk 

74.68% 

162 

Birkenhead 

74.71% 

163 

Cambridge 

74.80% 

164 

Nottingham North and Kimberley 

74.92% 

165 

North East Hertfordshire 

74.92% 

166 

Chelmsford 

74.94% 

167 

St Helens South and Whiston 

75.20% 

168 

Havant 

75.24% 

169 

Rayleigh and Wickford 

75.34% 

170 

Bristol North West 

75.49% 

171 

Dulwich and West Norwood 

75.62% 

172 

Gainsborough 

75.84% 

173 

Birmingham Hodge Hill and Solihull North 

75.92% 

174 

Leeds Central and Headingley 

75.94% 

175 

Middlesbrough South and East Cleveland 

76.03% 

176 

Daventry 

76.05% 

177 

Orpington 

76.13% 

178 

Rotherham 

76.23% 

179 

East Thanet 

76.40% 

180 

Edmonton and Winchmore Hill 

76.46% 

181 

Birmingham Yardley 

76.48% 

182 

Slough 

76.62% 

183 

Aldridge-Brownhills 

76.82% 

184 

Whitehaven and Workington 

76.85% 

185 

Kingswinford and South Staffordshire 

76.86% 

186 

Chester North and Neston 

76.95% 

187 

Islington South and Finsbury 

77.15% 

188 

Burton and Uttoxeter 

77.29% 

189 

Weston-super-Mare 

77.31% 

190 

Chatham and Aylesford 

77.38% 

191 

Kensington and Bayswater 

77.40% 

192 

North Warwickshire and Bedworth 

77.43% 

193 

Sussex Weald 

77.46% 

194 

Enfield North 

77.65% 

195 

Ilford North 

77.67% 

196 

Streatham and Croydon North 

77.72% 

197 

South Basildon and East Thurrock 

77.93% 

198 

West Ham and Beckton 

77.96% 

199 

Southend West and Leigh 

77.99% 

200 

Hayes and Harlington 

78.00% 

201 

North Devon 

78.06% 

202 

North Norfolk 

78.08% 

203 

Widnes and Halewood 

78.09% 

204 

Hove and Portslade 

78.10% 

205 

Wolverhampton West 

78.13% 

206 

Central Devon 

78.23% 

207 

Leicester East 

78.31% 

208 

Honiton and Sidmouth 

78.38% 

209 

Witney 

78.45% 

210 

Sunderland Central 

78.63% 

211 

Bury St Edmunds and Stowmarket 

78.75% 

212 

Torridge and Tavistock 

78.76% 

213 

Truro and Falmouth 

78.88% 

214 

Dewsbury and Batley 

78.94% 

215 

Sevenoaks 

78.95% 

216 

Wokingham 

79.03% 

217 

Grantham and Bourne 

79.10% 

218 

Beverley and Holderness 

79.11% 

219 

Stafford 

79.15% 

220 

Leeds South West and Morley 

79.27% 

221 

Lichfield 

79.30% 

222 

Epsom and Ewell 

79.46% 

223 

Dorking and Horley 

79.51% 

224 

North Shropshire 

79.52% 

225 

West Lancashire 

79.54% 

226 

St Austell and Newquay 

79.72% 

227 

Dartford 

79.72% 

228 

Newton Abbot 

79.72% 

229 

York Central 

79.80% 

230 

Rutland and Stamford 

79.80% 

231 

Middlesbrough and Thornaby East 

79.82% 

232 

Lincoln 

79.82% 

233 

Altrincham and Sale West 

79.84% 

234 

Mid Cheshire 

79.86% 

235 

Dagenham and Rainham 

79.88% 

236 

West Suffolk 

79.91% 

237 

Redcar 

79.93% 

238 

Stockton West 

79.98% 

people

 Matthew Roberts

Share your views

Nature is still considered to be something that’s ‘nice to have’, instead of something that is necessary for everyone. Help us to change that by sharing your views. We want to hear your story, about how nature has helped you. We'll use those stories to speak to MPs and Ministers about the importance of access to nature. 

Add your voice